
Wing Tips: Interactive Python in Wing Pro: The Debug Probe
Wing Pro is a Python IDE with a powerful debugger that makes it easier to work interactively with Python. In addition to debugging, it is also a great way to navigate and understand unfamiliar code, and to write new code interactively in the live runtime state for which it is being designed.
Debug Probe
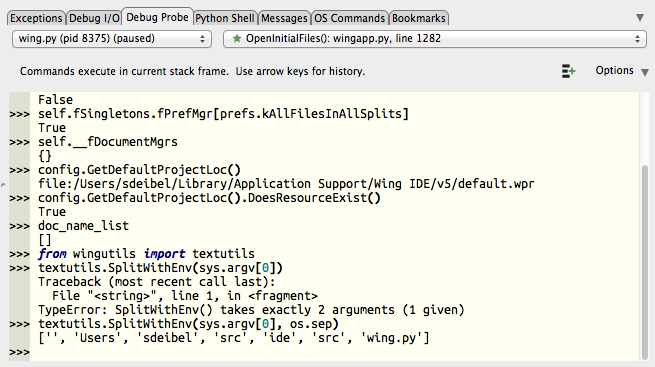
The Debug Probe is an important part of Wing Pro's support for interactive development. This is a Python shell that works in the current debug stack frame when the debug process is paused by a breakpoint or exception.
To use the Debug Probe, set a breakpoint in your code and start debugging
from the toolbar icon  or Debug menu. When you reach the breakpoint
or any exception, you can start working interactively in the Debug Probe.
or Debug menu. When you reach the breakpoint
or any exception, you can start working interactively in the Debug Probe.
The menus at the top of the Debug Probe are used to select the process, thread, and stack frame you want to work within. Any changes made in the Debug Probe, or side effects of code that is invoked here, are made within the selected stack frame.
The Debug Probe provides auto-completion that is integrated with Wing's Source Assistant, where you can see call signature, documentation, and other information relevant to the code you are typing.
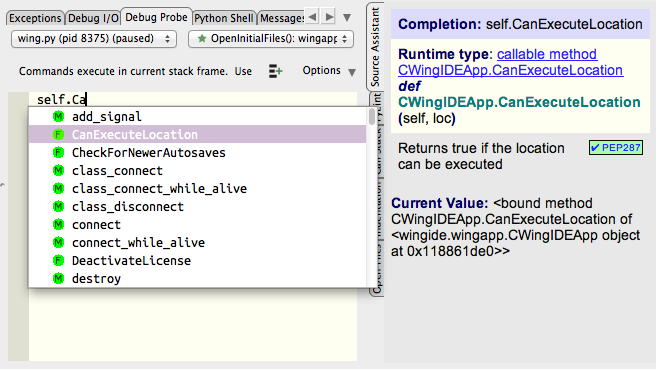
You can easily jump to point of definition of symbols in the debug probe or their types by pressing F4 or by navigating from the links in the Source Assistant.
Conditional Breakpoints
Conditional breakpoints are handy for isolating a particular case for which new code is being written, giving you direct and convenient access to the actual data being passed to the code that you are working on. Everything you write can immediately be tested against the live runtime state.
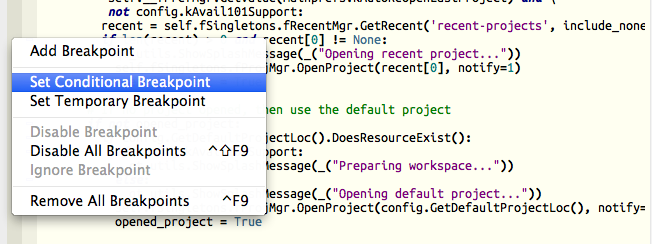
To set or edit a conditional breakpoint, right click on the left-most margin in the editor. Breakpoints can also be ignore-counted or enabled/disabled from here, and an overview of breakpoints with statistics is available in the Breakpoints tool in the Tools menu.
Active Ranges
In some cases it's useful to set a range of code in the editor as active in the Debug Probe, in order to make it easier to execute while working on it. This is done with the icons in the upper right corner of the Debug Probe.
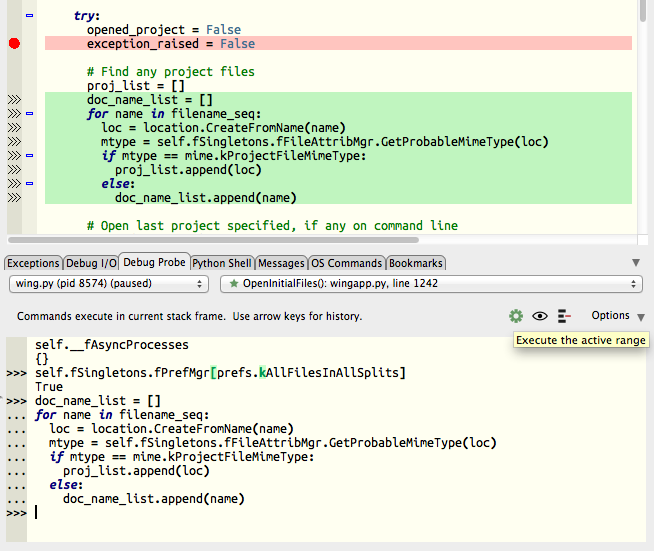
Once an active range is set, it is highlighted in the editor and can be sent to the Debug Probe by pressing the icon in the top right of the Debug Probe or by binding a key to the command debug-probe-evaluate-active-range.
Getting Started with Wing Pro
A quick introduction to Wing Pro's features can be found in our Feature Overview Screencast.
Or just download Wing Pro and give it a try. The Tutorial in Wing's Help menu is a great way to get started.
Share this article: