
Wing Tips: Multiprocess Debugging in Wing IDE Pro 5.1
Wing IDE Pro's debugger makes is easier to work interactively with Python. In addition to debugging, it is also a great way to navigate and understand unfamiliar code, and to write new code interactively in the live runtime state for which the code is being designed.
Starting with Wing 5.1, multiple debug connections can be made at once, so it is much easier to write and debug multi-process code.
Multi-Process Debugging
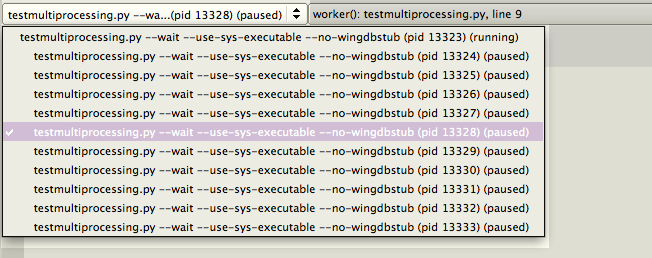
Wing 5.1 adds a process selector wherever a stack selector is shown in the user interface, in addition to a thread selector if there are multiple threads in the debug process. The process selector groups processes into a process tree, showing the relationship between them regardless of how they were created or debug-enabled.
When multiple processes are being debugging, pressing the Alt key causes the Debug/Continue, Stop, Restart, and Pause toolbar icons to apply that operation to all the active processes:

These operations are also in the Debug > Processes menu, along with commands for starting additional new debug processes from the IDE.
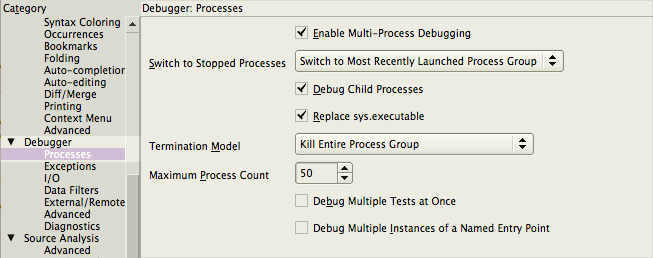
Options to control multi-process debugging are in the Debugger > Processes preferences group. For example, you can control when Wing switches to a newly attached debug process and which processes to kill when killing a single debug process.
Automatically Debugging Child Processes
Optionally, you can also automatically debug-enable sub-processes created with multiprocessing, via sys.executable, and (on Posix) with os.fork().
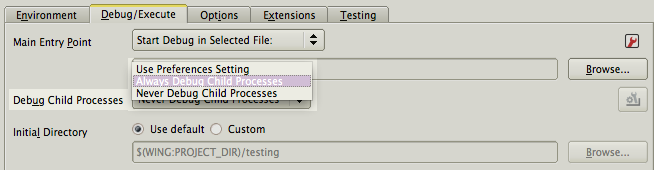
Automatically debugging child processes is off by default since it can be confusing or unwanted in some code bases. It can be enabled with the Debugger > Processes > Debug Child Processes preference or (preferably, in most cases) on a project-by-project basis with the Debug/Execute > Debug Child Properties setting in Project Properties.
This option is useful when working with auto-reloading web application frameworks like Flask or Google App Engine, because Wing will automatically debug the reloaded server processes.
Manually Debugging Child Processes
There are cases where sub- processes cannot be automatically debugged, such as when os.exec() is used (on Posix) or if the process is started without referencing sys.executable. In these cases, the process can still be debugged by importing wingdbstub, which is a module provided by Wing IDE to initiate debugging from outside of the IDE.
In these cases, you will need to enable Accept Debug Connections by clicking on the bug icon in the lower left of Wing's window. This causes Wing to use a fixed port for accepting debug connections. The default matches the port configured wingdbstub.py in your Wing IDE installation.
Details on doing this are in Debugging Externally Launched Code in Wing's reference manual.
Resources
More information can be found in Multi-Process Debugging in the Wing IDE manual.
A quick introduction to Wing IDE's features can be found in our Feature Overview Screencast.
Or just download Wing IDE and give it a try. The Tutorial in Wing's Help menu is a great way to get started.
Share this article: