
Tutorial: Other Debugger Features

Before moving on, let's look at a few other debugger features that are worth knowing about.
Move Program Counter
Wing Pro can move the position of the program counter in the innermost stack frame, when the debugger is paused and not at an exception. This is done by right-clicking on the line where the counter should be moved and selecting Move Program Counter Here.
This capability allows stepping through already-executed code, by executing it again, so that a problem can be inspected without restarting the debugger.
Due to the way Python is implemented, this is possible only in the innermost stack frame and only if the debugger did not stop at an exception.
Debug Value Tips
Hovering the mouse cursor over symbols in the editor while the debug process is paused will show the value of that symbol, if it is defined in the current stack frame. Similarly, pressing Shift-Space will display debug data values for all visible symbols on the editor.
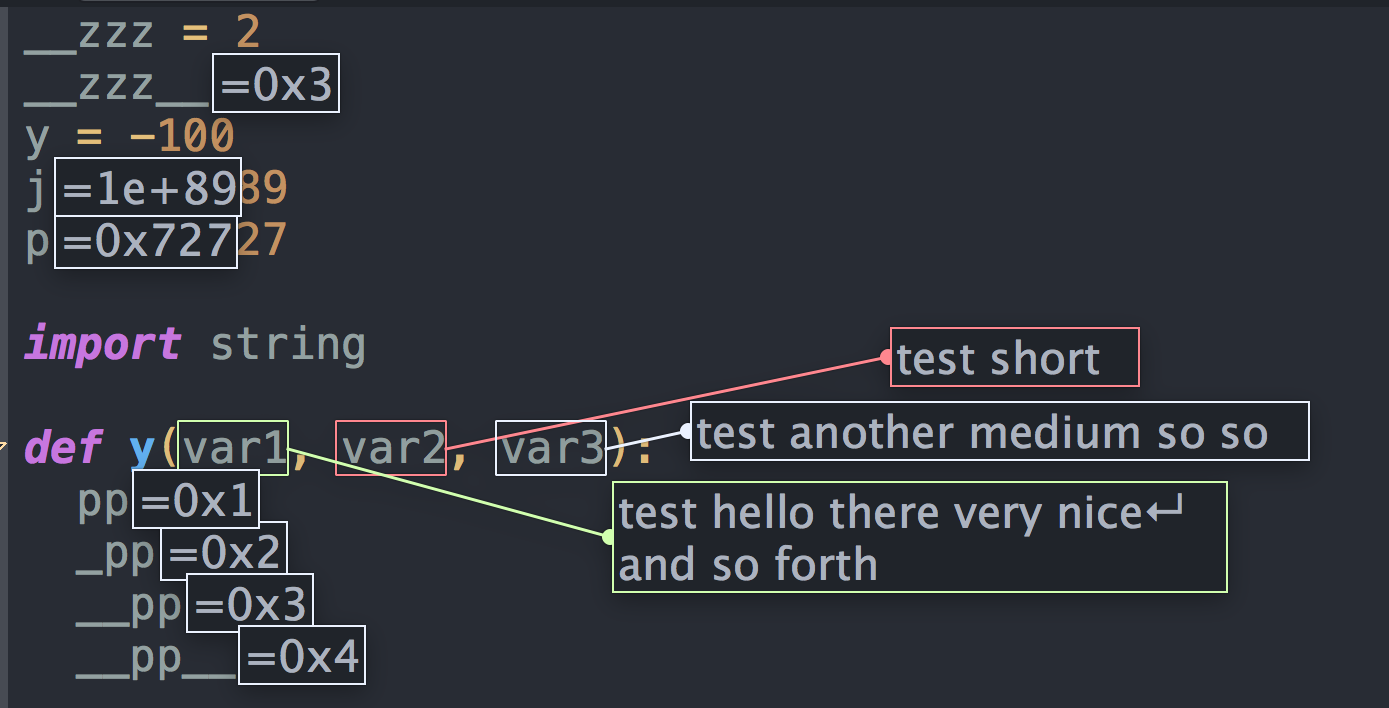
See Viewing Data on the Editor for details.
Viewing Arrays
Selected items in the Stack Data tool can be viewed as arrays from the tool's Options menu. This works with Python's builtin data types, numpy arrays, pandas DataFrames, and sqlite3 query results, among other things.
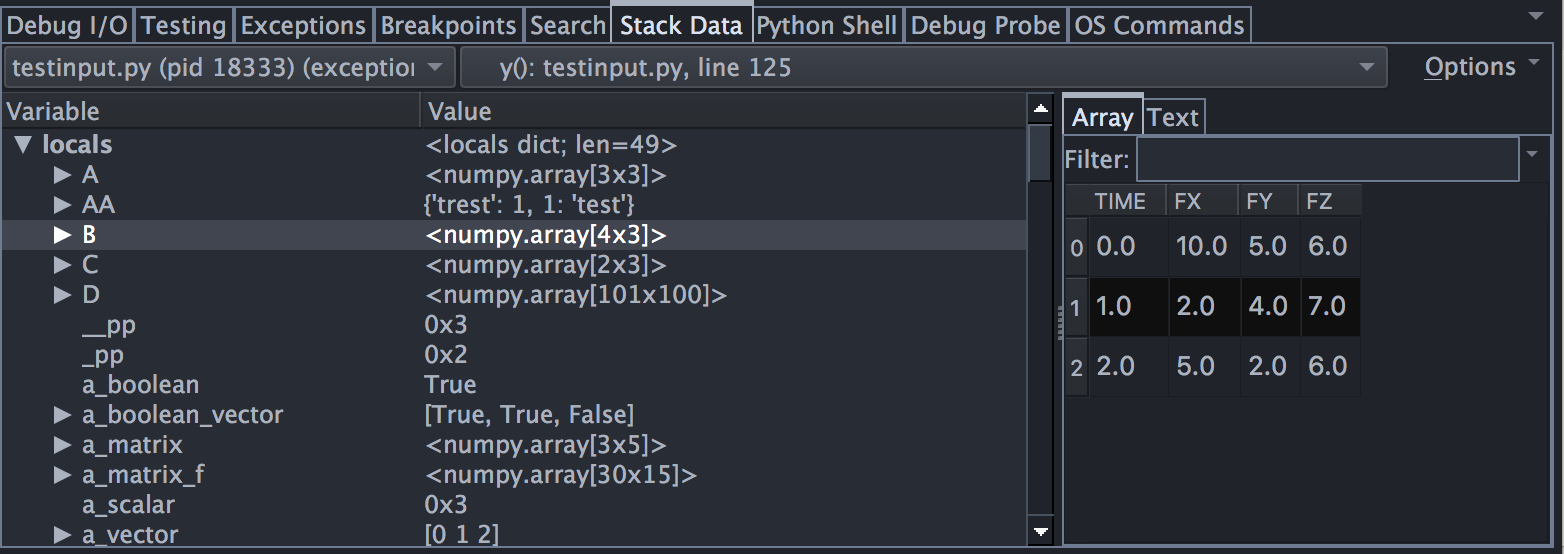
Data is loaded incrementally as needed for display on screen, making this a good way to inspect large datasets without transferring large amounts of data to the IDE.
See Array and Textual Data Views for details.
Watch Tool
The Watch tool lets you watch variables over time by symbolic name or object reference, by right-clicking on them in the Stack Data, Modules, or Watch tools.
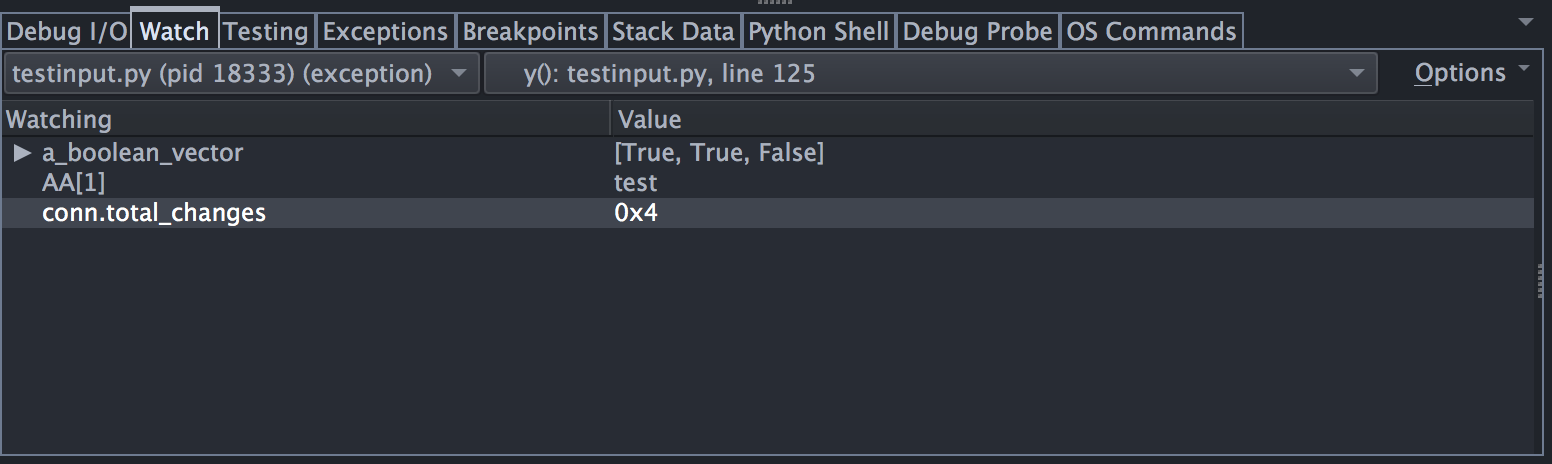
Watching a value by object reference is a great way to inspect an instance while debugging even if you step out of code that contains easily accessible references to it.
You can also watch expressions typed into the Watching column of the Watch tool.
See Watching Values for details.
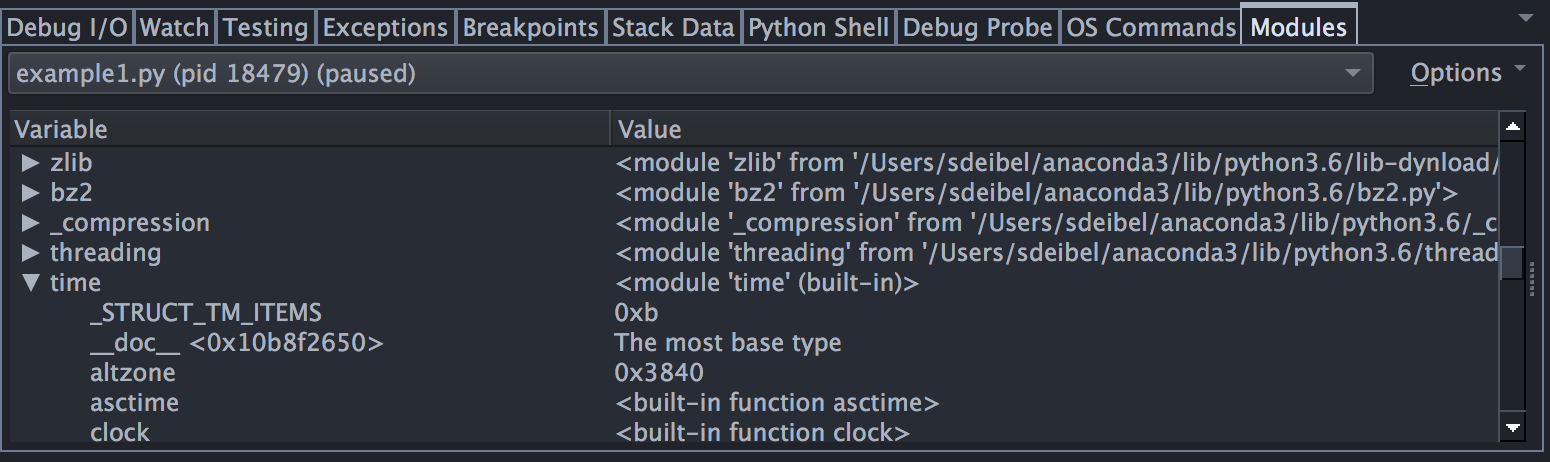
Modules Data View
By default, Wing filters out modules and some other data types from the values shown in the Stack Data tool. In some cases, it is useful to view values stored in modules. This can be done with the Modules tool, which is simply an expandable list of all modules found in sys.modules:
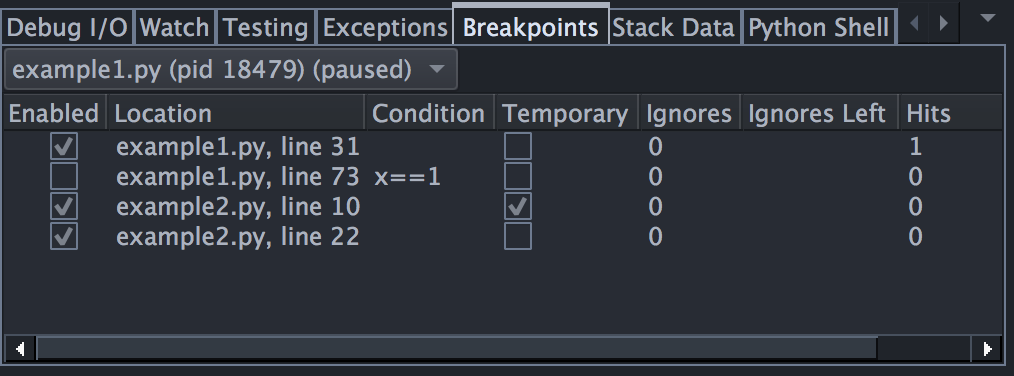
Breakpoint Manager
The Breakpoints tool shows a list of all defined breakpoints and allows enabling or disabling, editing the breakpoint condition, setting an ignore count, and inspecting the number of times a breakpoint has been reached during the life of a debug process.
See Setting Breakpoints for details.