Wing Tips: Using Matplotlib with Wing Python IDE
Wing supports interactive development and debugging of Python code designed for the Matplotlib numerical and scientific plotting library, so plots can be shown and updated from the command line. For example, two plots could be shown in succession by typing the following into Wing's Python Shell, one line at a time:
from matplotlib.pyplot import plot, show
x = range(10)
plot(x)
show()
y = [2, 8, 3, 9, 4] * 2
plot(y)
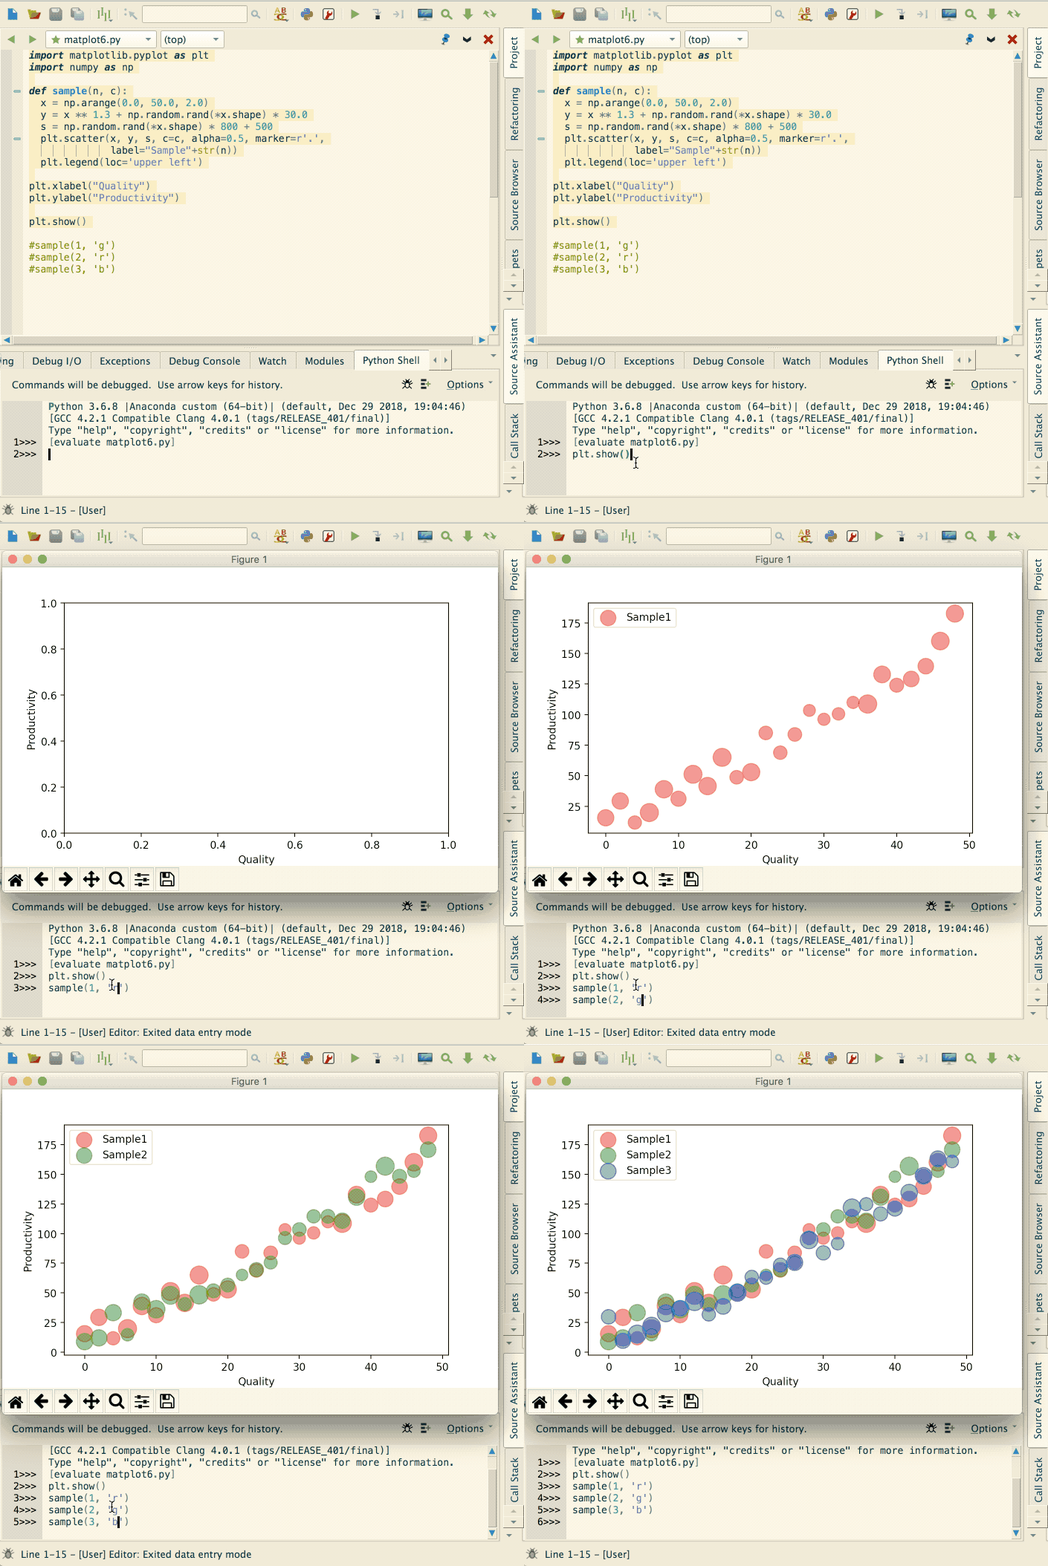
Wing sets up the environment so that show() runs to completion and immediately returns you to the prompt, rather than waiting until the plot is closed. In addition, Wing calls Matplotlib's main loop to keep plots windows interactive and updating while you are at the prompt. This allows plots to be added or changed without restarting a process or interrupting your work flow:

Working interactively with Matplotlib from Wing's Python Shell
Evaluating Files and Selections
Code from the editor can be executed in the Python Shell with the Evaluate ... in Python Shell items in the Source menu and in the editor's right-click context menu. By default the Python Shell restarts automatically before evaluating a whole file, but this can be disabled in its Options menu.
Active Ranges
Wing also allows you to set a selected range of lines in the editor as the "active range"
for the Python Shell by clicking the ![]() icon in the top right of the Python
Shell tool:
icon in the top right of the Python
Shell tool:

Wing highlights and maintains the active range as you edit it in the editor, and it can be
re-evaluated easily with the ![]() icon that appears in the top right of the
Python Shell once an active range has been set into it.
icon that appears in the top right of the
Python Shell once an active range has been set into it.
Use the ![]() icon to clear the active range from the editor and shell.
icon to clear the active range from the editor and shell.
Supported Backends
Interactive development is supported for the TkAgg, GTKAgg, GtkCairo, WXAgg (for wxPython 2.5+), Qt5Agg, Qt4Agg, MacOSX, and WebAgg backends. It will not work with other backends.
Debugging
Code can be debugged either by launching a file with ![]() in the toolbar (or
Start/Continue the Debug menu) or by enabling debug in the integrated Python
Shell and working from there. In either case, Wing can be used to reach breakpoints or
exceptions, step through code, and view the program's data. For general information on
using Wing's debugger see the Debugger Quick Start.
in the toolbar (or
Start/Continue the Debug menu) or by enabling debug in the integrated Python
Shell and working from there. In either case, Wing can be used to reach breakpoints or
exceptions, step through code, and view the program's data. For general information on
using Wing's debugger see the Debugger Quick Start.
When executing code that includes show() in the debugger, Wing will block within the show() call just as Python would if launched on the same file. This is by design, since the debugger seeks to replicate as closely as possible how Python normally runs.
However, interactive development from a breakpoint or exception is still possible, as described below. This capability can be used to load setup code before interacting with Matplotlib, or to try out a fix when an exception has been reached.
Interactive Debugging from the Debug Console (Wing Pro only)
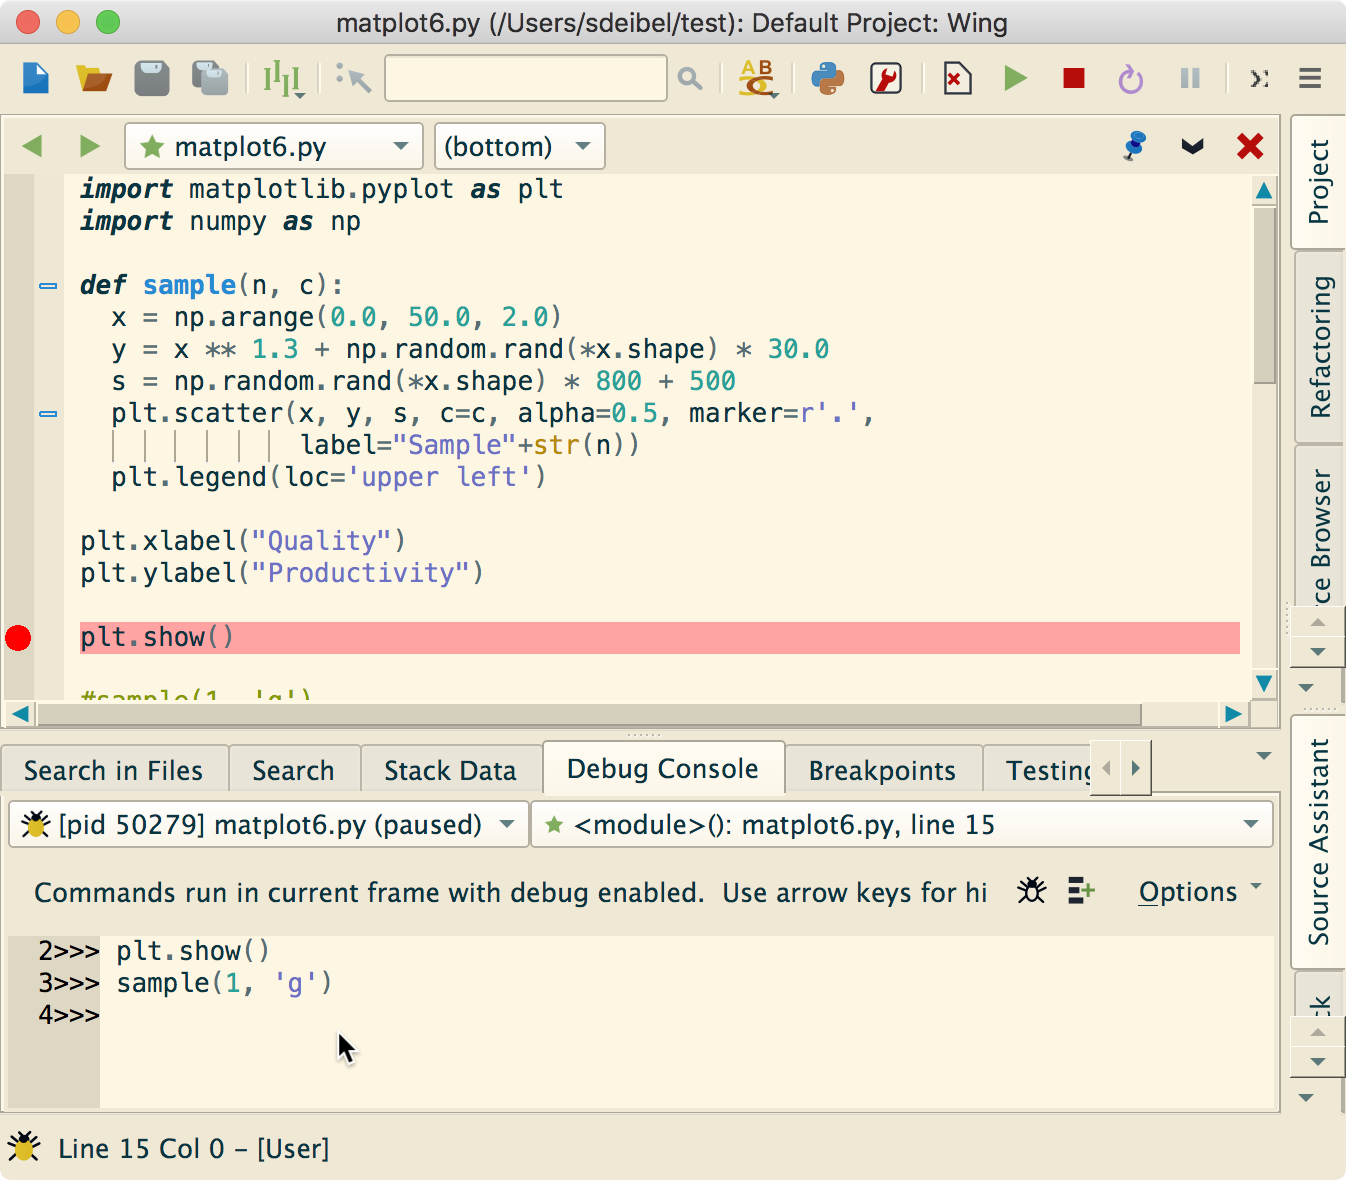
Whenever the debugger is stopped at a breakpoint or exception, Wing Pro's Debug Console provides a command prompt that may be used to inspect and interact with the paused debug process. Commands entered here run in the context of the currently selected debug stack frame:

The tool implements the same support for interactive development provided by the Python Shell, so plots may be shown and modified interactively whenever Wing's debugger is paused. Once the debug process is continued, Wing switches off interactive mode and returns to behaving in the same way that Python would when running the code outside of the debugger.
Interactive Debugging from the Python Shell
Another way to combine the debugger with interactive development is to turn on both Enable Debugging and Enable Recursive Prompt in the Python Shell's Options menu:

This causes Wing to add a breakpoint margin to the Python Shell and to stop in the debugger if an exception or breakpoint is reached, either in code in the editor or code that was entered into the Python Shell.
The option Enable Recursive Prompt causes Wing to show a new recursive prompt in the Python Shell whenever the debugger is paused, rather than waiting for completion of the original command before showing another prompt. Showing or updating plots from recursive prompts works interactively in the same way as described earlier.
If another exception or breakpoint is reached, Wing stops at those as well, recursively to any depth. Continuing the debug process from a recursive prompt completes the innermost invocation and returns to the previous recursive prompt, unless another exception or breakpoint is reached first.
Trouble-shooting
If show() blocks when typed into the Python Shell, if plots fail to update, or if you run into other event loop problems while working with Matplotlib, then the following may help solve the problem:
(1) When working in the Debug Console, evaluate the imports that set up Matplotlib first, so that Wing can initialize its event loop support before show() is called. Evaluating a whole file at once in the Debug Console (but not the Python Shell) will cause show() to block if Matplotlib was not previously imported.
(2) In case there is a problem with the specific Matplotlib backend that you are using, try the following as a way to switch to another backend before issuing any other commands:
import matplotlib
matplotlib.use('TkAgg')
Instead of TkAgg you may also try other supported backends, including Qt5Agg (which requires that Qt5 is installed) or WebAgg (which uses a web browser for plot display).
As always, please email support@wingware.com if you run into problems that you cannot resolve.
That's it for now! We'll be back soon with more Wing Tips for Wing Python IDE.
Share this article:


